TL;DR:
- The most important help desk KPIs are first contact resolution (FCR), first response time, mean time to resolve (MTTR), SLA compliance, and CSAT.
- Track five to seven at most, and pair each one with a metric that keeps it honest.
- Add device data so you can see why tickets happen, not just how fast they close.
A help desk can hit every SLA target this quarter and still cost employees hours of work every week. The dashboard stays green because it measures how tickets move, not what they cost the business.
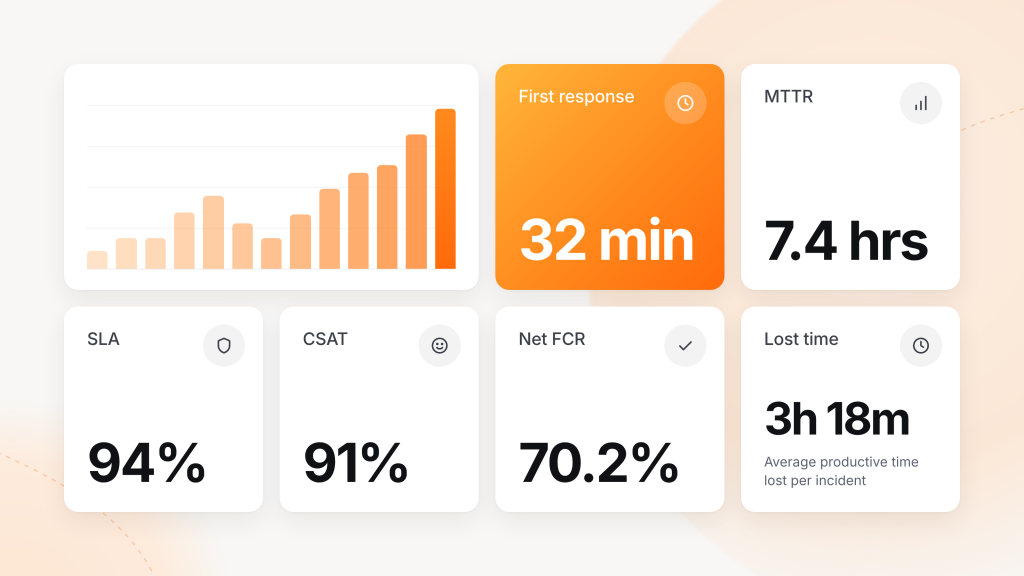
That cost is real. HappySignals’ 2026 Global IT Experience Benchmark, built on nearly 2 million employee responses, found that employees lose an average of 3 hours and 18 minutes of productive time per IT incident. Most help desk reporting never shows that number.
This guide covers the help desk metrics and KPIs that matter for internal IT teams: formulas, sourced benchmarks, the metrics worth dropping, and the asset KPIs most service desk dashboards miss.
What are help desk metrics and KPIs?
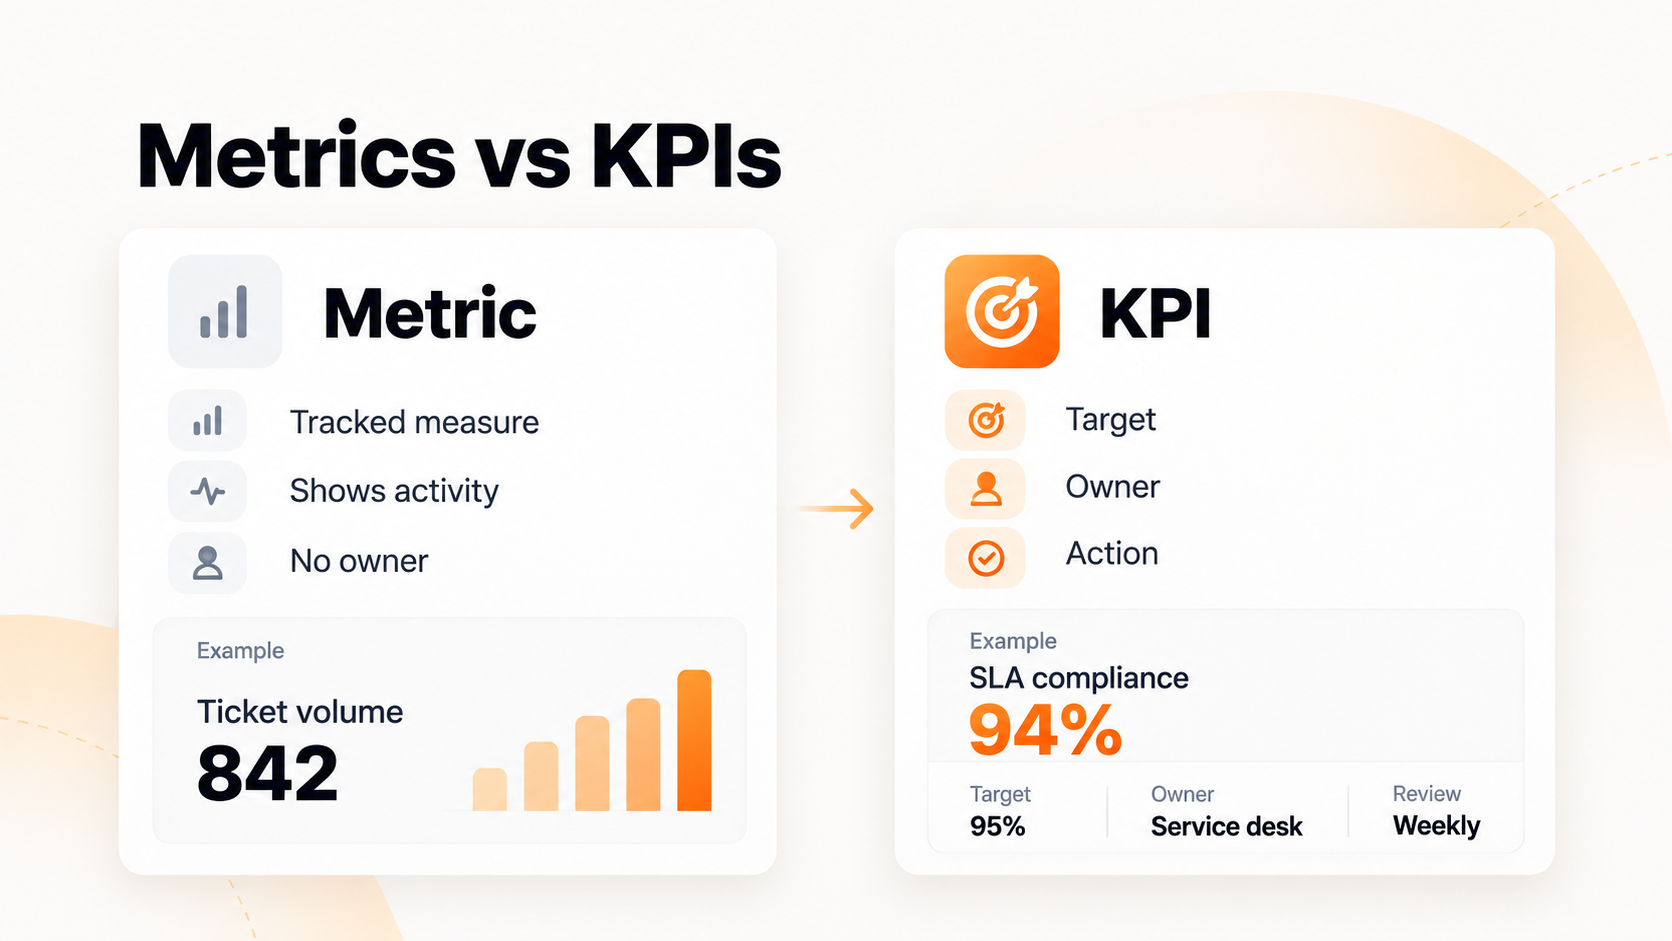
Help desk metrics are any measurable data points about your support operation, such as ticket counts, response times, and survey scores. Help desk KPIs are the few metrics you tie to a target, an owner, and an action when they slip.
Every KPI is a metric. Most metrics should never become KPIs.
Help desk vs. service desk KPIs
The terms overlap in practice. A help desk focuses on break/fix support, while a service desk in ITIL terms also handles service requests, onboarding, and changes. If you want the full distinction, see our guide to ITSM vs. ITIL. The KPIs below apply to both.
The 10 help desk KPIs that matter
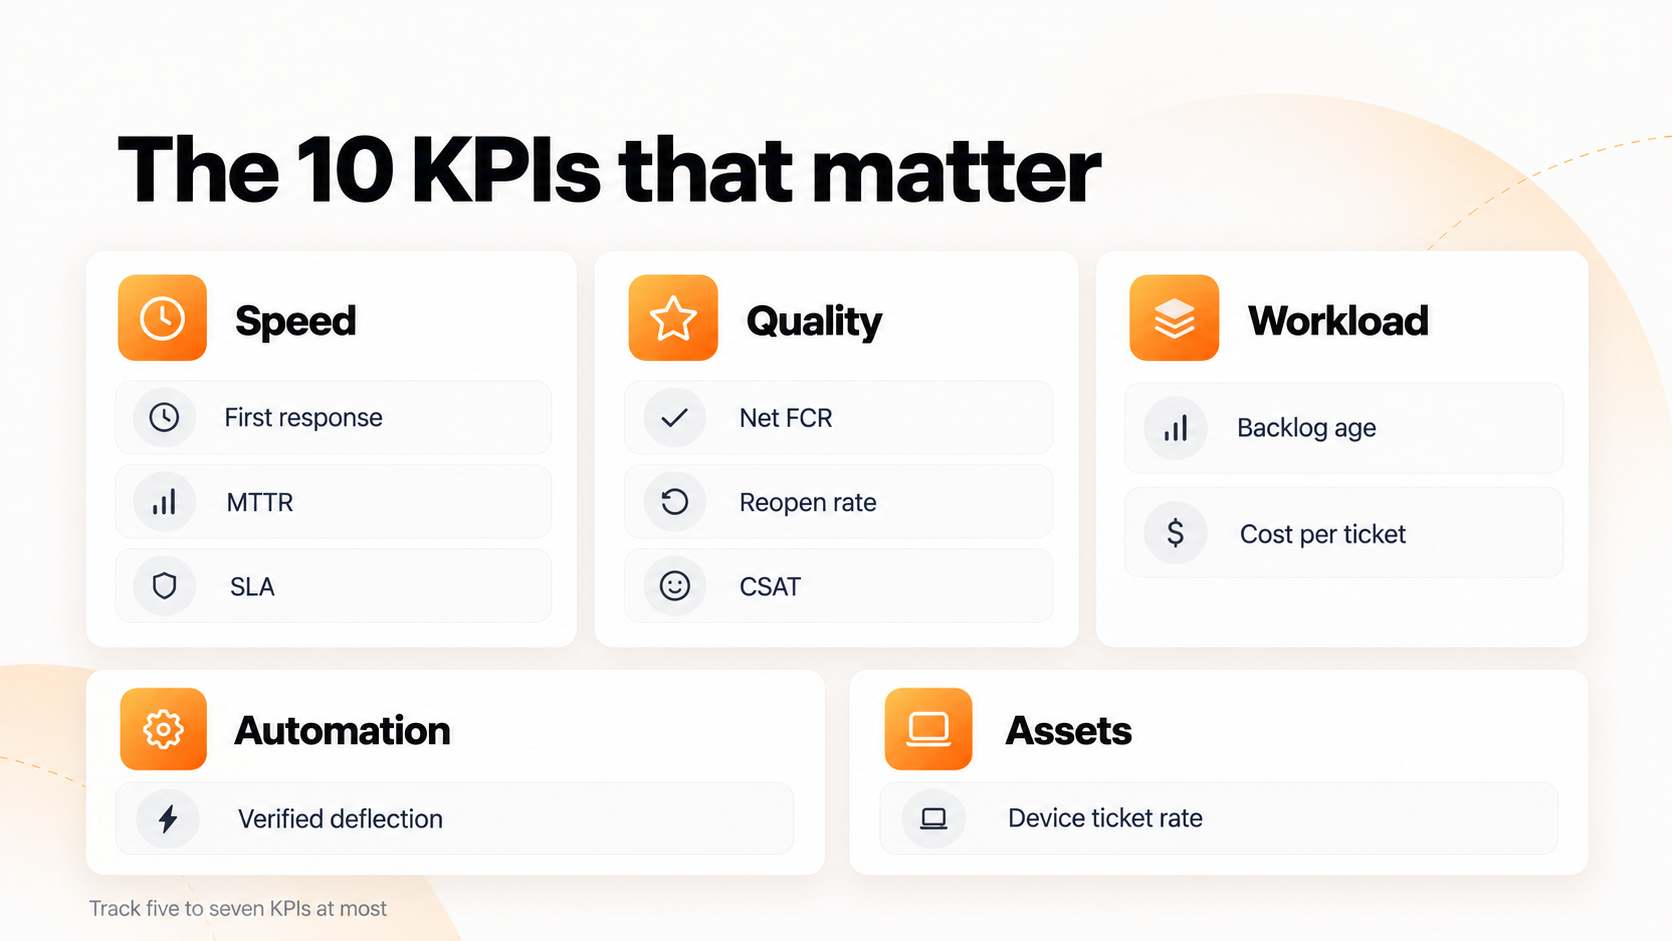
Each KPI below includes a formula, a benchmark where a credible one exists, and the metric to pair it with.
Speed: how fast employees get help
| KPI | Formula | Benchmark | Pair with |
|---|---|---|---|
| 1. First response time (FRT) | Total time to first human response ÷ tickets | Set by priority in your SLA | Time to resolution |
| 2. Mean time to resolve (MTTR) | Total resolution time ÷ resolved tickets | Varies by priority and ticket mix | Reopen rate |
| 3. SLA compliance | Tickets resolved within SLA ÷ total tickets × 100 | Set per priority tier | CSAT |
Document where each clock starts. One team measuring FRT from ticket creation and another from assignment will never produce comparable numbers.
Also watch MTTR in context. If self-service absorbs your easy tickets, MTTR can rise even as service improves, because only the harder work reaches agents.
Quality: whether the fix actually worked
| KPI | Formula | Benchmark | Pair with |
|---|---|---|---|
| 4. First contact resolution (FCR) | Tickets resolved on first contact ÷ total tickets × 100 | 70.2% average net FCR (MetricNet, 2023) | Reopen rate |
| 5. Reopen rate | Reopened tickets ÷ resolved tickets × 100 | No universal benchmark; track the trend | FCR, MTTR |
| 6. CSAT | Positive survey responses ÷ total responses × 100 | Depends on survey design | Lost time per incident |
Use net FCR, which excludes tickets that can’t be solved on first contact, such as a laptop that needs a physical swap. Gross FCR punishes your desk for problems no agent could fix over chat.
Workload and cost: what the desk can sustain
| KPI | Formula | Benchmark | Pair with |
|---|---|---|---|
| 7. Backlog age | Average age of open tickets | Track against your SLA targets | MTTR |
| 8. Cost per ticket | Total help desk operating cost ÷ tickets in the period | Varies widely by staffing model and region | FCR, CSAT |
AI and self-service: whether automation solved anything
| KPI | Formula | Benchmark | Pair with |
|---|---|---|---|
| 9. Verified deflection rate | Self-service sessions with no ticket or repeat contact within 7 days ÷ total sessions × 100 | Too new for reliable benchmarks | Repeat contact rate |
A chatbot conversation that ends is not a resolved issue. Count deflection only when the employee didn’t come back with the same problem.
Asset and lifecycle: why tickets happen
| KPI | Formula | Benchmark | Pair with |
|---|---|---|---|
| 10. Device-related ticket rate | Hardware and device tickets ÷ total tickets × 100 | No public benchmark | Ticket rate by device age |
Help desk KPIs measure tickets. Asset KPIs explain why tickets happen. HappySignals’ 2025 benchmark flagged laptops and computers as a category where dissatisfaction is tied to lost time.
To get under the device ticket rate, add these supporting desktop support metrics:
- Ticket rate by device age: tickets per device, grouped into age bands such as 0 to 2 years and 3 to 4 years
- Time-to-equip: days from hire request to a configured device in the new hire’s hands
- Device recovery time: days from an employee’s last day to the device being received
- Replacement turnaround: days from a failed device ticket to a working replacement, especially for remote staff
If four-year-old laptops generate twice the tickets of newer ones, the fix is a device refresh plan, not more agents.
Help desk KPI examples by goal
Start with the outcome you need, then choose the KPI set.
| Goal | KPI set |
|---|---|
| Reduce employee downtime | MTTR, backlog age, lost time per incident |
| Improve service quality | FCR, reopen rate, CSAT |
| Control support costs | Cost per ticket, net FCR, verified deflection |
| Support distributed teams | Time-to-equip, replacement turnaround, device-related ticket rate |
| Prove value to leadership | SLA compliance, lost time per incident, cost per ticket |
Metrics to stop using as KPIs
These numbers still belong on an operations report. They just shouldn’t be targets.
- Ticket volume: it drops when automation works and when employees give up on IT. Use it for capacity planning.
- Tickets closed per agent: it rewards speed over fixes and ignores how hard each ticket was.
- Average handle time (AHT): pressure to cut it leads to rushed fixes and reopened tickets. It’s useful for staffing models.
- Agent utilization: high utilization often signals burnout risk, not productivity.
Help desk metrics best practices: pair metrics to prevent gaming
Any single KPI can be gamed. Pairing makes the shortcut visible.
| KPI | Can be gamed by | Pair with |
|---|---|---|
| FCR | Closing tickets before the fix is confirmed | Reopen rate |
| MTTR | Closing early or pushing simple work to self-service | Reopen rate, backlog age |
| First response time | Auto-replies that say nothing | Time to resolution |
| SLA compliance | Downgrading priority or pausing clocks | CSAT, audit of priority changes |
| Deflection | Counting abandoned chats as solved | Repeat contact within 7 days |
Three practices keep the scorecard useful:
- Cap your list at five to seven KPIs. Many desks never get this far. MetricNet reports that fewer than half of service desks set performance targets for their KPIs at all.
- Write down every definition. Include when the clock starts, what counts as resolved, and which tickets are excluded.
- Set a review cadence. Review backlog and SLA weekly, FCR and CSAT monthly, and cost and device trends quarterly.
How to report help desk performance metrics to leadership
Executives don’t think in ticket counts. They think in hours and dollars.
Here is a practical example. A 1,500-person company logs 900 incidents a month. At HappySignals’ global average of about 3.3 hours lost per incident, that’s roughly 2,970 hours of lost productivity every month. Your own number will differ, but the framing gets attention that an SLA chart never will.
A one-page monthly report should cover:
- Employee time lost to IT issues, and the trend
- Cost per ticket
- SLA compliance by priority
- CSAT trend
- The top three repeat issues and the fix for each
Focus the fixes where the time goes. HappySignals found that 13% of tickets account for 80% of lost work time, and that lost time climbs from 2 hours to over 9 hours as tickets bounce between teams.
Your Help Desk Can’t Fix What It Can’t See
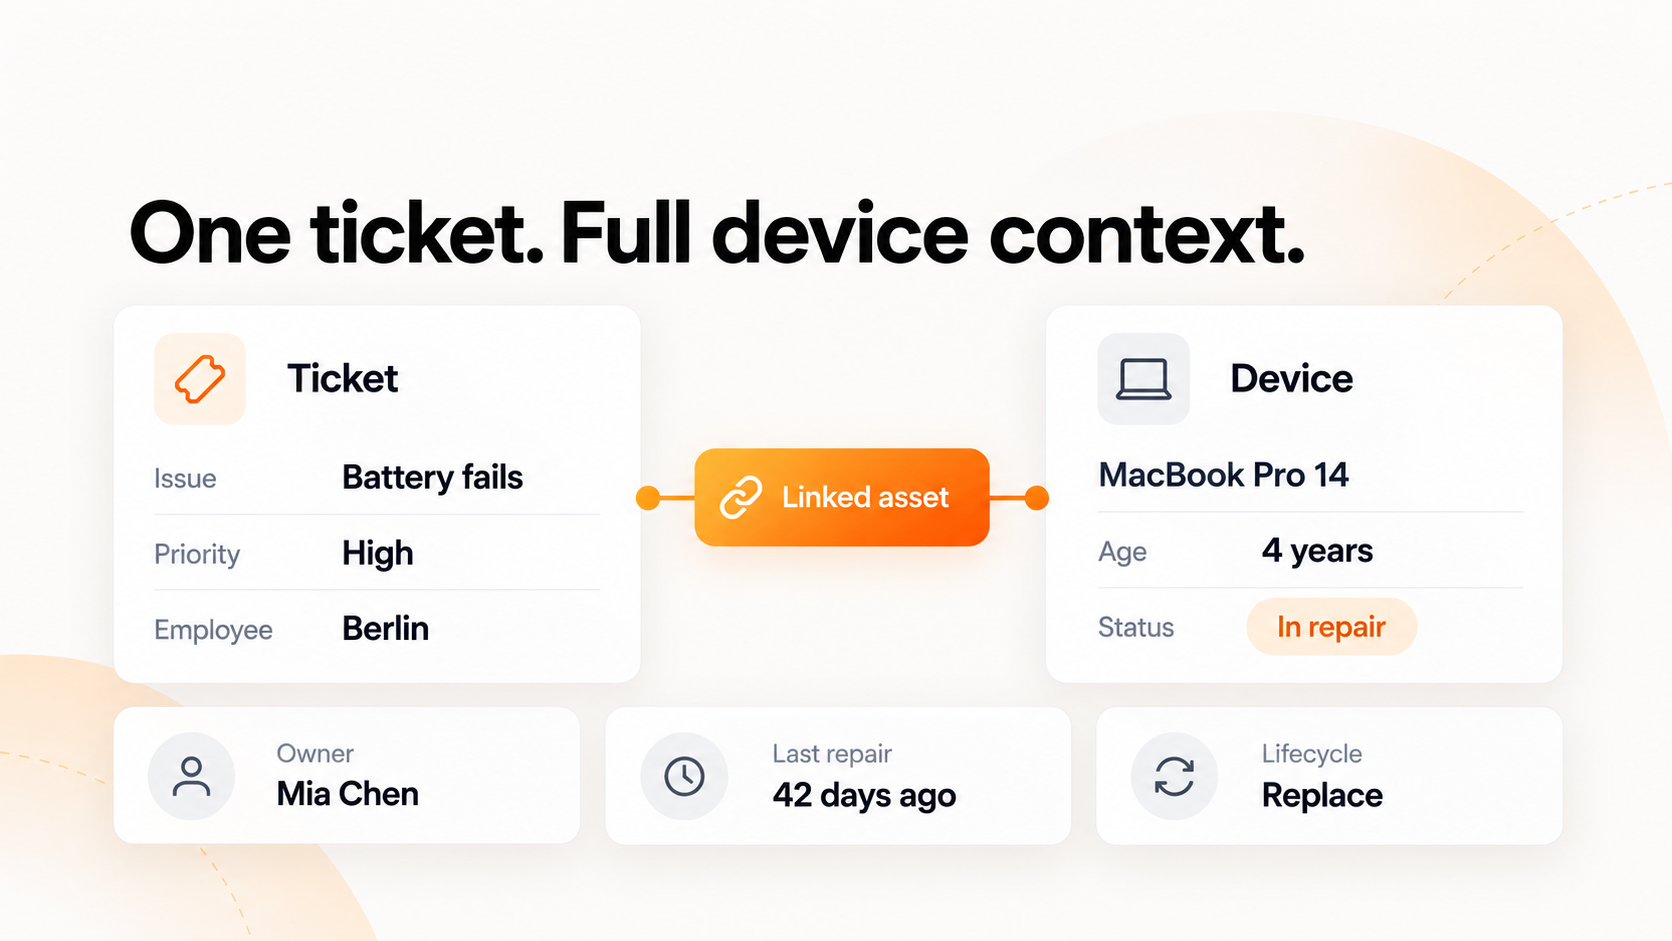
Most help desk tools see the ticket. They don’t see the laptop behind it: its age, owner, repair history, or where it sits in its lifecycle. So the same device creates the same ticket three times before anyone recommends a replacement.
Unduit connects IT service management and IT asset management in one platform, built for mid-market teams with distributed workforces.
- Unified ticketing with asset context: tickets and assets live in one system, so agents see device ownership and lifecycle status without switching tools.
- SLA tracking and automated workflows: track SLAs by priority and automate routine routing and follow-up.
- Real-time asset visibility: centralized tracking with clear ownership and lifecycle insights for every device.
- Automated lifecycle operations: procurement, deployment, shipping, recovery, repair, remarketing, and recycling, which directly improves time-to-equip and device recovery time.
- Works with your existing stack: integrates with Jira, Jamf, Microsoft Intune, Iru (formerly Kandji), and HRIS platforms.
- Audit-ready governance: SOC 2, ISO 27001, and R2 certified, with documented chain of custody for recovered devices.
- Global support: consistent workflows wherever your teams work.
The result is a help desk that can measure the ticket and fix the cause behind it.
FAQ
What are the 5 most important help desk KPIs?
First contact resolution, first response time, mean time to resolve, SLA compliance, and CSAT. Together they cover speed, quality, and employee experience. Pair each with a balancing metric such as reopen rate.
What is the difference between help desk metrics and KPIs?
A metric is any data point your help desk tracks. A KPI is a metric tied to a target and an owner, reviewed on a set schedule and used to make decisions.
How many help desk KPIs should you track?
Five to seven. More than that dilutes attention, and teams stop acting on any of them. Keep other metrics on an operational report instead.
Is ticket volume a good help desk KPI?
No. Volume falls when automation works and when employees stop asking IT for help, so the number alone can’t tell you which happened. Use it for capacity planning.
What should a help desk KPI dashboard include?
Each KPI with its current value, target, trend, owner, and paired metric. Add employee time lost and device-related ticket rate to connect desk performance to business impact.